Unveiling Netflix: Sentiment Analysis, Trending Years, and the COVID Impact
Python Chronicles: Netflix's Content Story

Netflix is a massive global player in the streaming entertainment industry that provides a wide range of content to its subscribers. We explore the patterns and insights pertaining to Netflix's content environment in this analysis, which spans the years 2010 to 2020. These include the rise and fall of releases as well as the tactical decisions taken in response to industry problems and consumer expectations.

Research Questions
What is the range of content accessible on Netflix?
How can similarities in the content on Netflix be identified?
What patterns exist between directors and actors in Netflix content?
How can Netflix's current priorities and strategic course be recognized?
How is sentiment analysis applied to Netflix content?
We will import the necessary libraries for this work before beginning our analysis.
import numpy as np
import pandas as pd
import plotly.express as px
from textblob import TextBlob

# Reading the CSV file
df = pd.read_csv('netflix_titles.csv')
print (df.shape)
This gives a result of (8807, 12) which tells us that there are 8807 rows and 12 columns in the dataset. We can then view the names of the columns using:
column_names = df.columns
print(column_names)
Distribution of Content
We will be generating a pie chart that will tell us the target audience based on ratings of Netflix content.
# Group by rating and calculate the percentage
rating_percentage = df.groupby('rating')['show_id'].count() / len(df) * 100

# Create the pie chart using Plotly Express
fig = px.pie(
    rating_percentage,
    names=rating_percentage.index,
    values=rating_percentage.values,
    title="Distribution of Content Ratings on Netflix",
    color_discrete_sequence=px.colors.qualitative.Set3,
    hole=0.4
)

# Show the plot
fig.show()
This shows that the majority of the content on Netflix is categorized as “TV-MA” i.e. the content targeted for a mature and adult audience.
Top 5 Directors and Actors
We will generate a bar chart showing the top 5 directors according to the total content. The x-axis will show the director’s name whereas, the y-axis will show the total content.
# Clean up missing director values
df['director'] = df['director'].fillna('No Director Specified')

# Split multiple directors and stack them
filtered_directors = df['director'].str.split(',', expand=True).stack()
filtered_directors = filtered_directors.to_frame()
filtered_directors.columns = ['Director']

# Count the total content for each director
directors = filtered_directors.groupby(['Director']).size().reset_index(name='Total Content')
directors = directors[directors['Director'] != 'No Director Specified']
directors = directors.sort_values(by=['Total Content'], ascending=False)

# Get the top 5 directors
directorsTop5 = directors.head()

# Create the bar chart
fig = px.bar(directorsTop5, x='Total Content', y='Director', title='Top 5 Directors on Netflix')
fig.show()
This shows that Rajiv Chilaka has a total content (movies and shows) of 22 and is the top director on Netflix in this aspect. Other top directors include Raul Campos, Jan Suter, Suhas Kadav, and Marcus Radboy.
Top 5 Actors on Netflix
We will generate a similar chart for the top 5 actors.
# Clean up missing cast values
df['cast'] = df['cast'].fillna('No Cast Specified')

# Split multiple actors and stack them
filtered_actors = df['cast'].str.split(',', expand=True).stack()
filtered_actors = filtered_actors.to_frame()
filtered_actors.columns = ['Actor']

# Count the total content for each actor
actors = filtered_actors.groupby(['Actor']).size().reset_index(name='Total Content')
actors = actors[actors['Actor'] != 'No Cast Specified']
actors = actors.sort_values(by=['Total Content'], ascending=False)

# Get the top 5 actors
actorsTop5 = actors.head()

# Create the bar chart
fig = px.bar(actorsTop5, x='Total Content', y='Actor', title='Top 5 Actors on Netflix')
fig.show()
From the above chart, it is evident that the top 5 actors include Anupam Kher, Rupa Bhimani, Takahiro Sakurai, Julie Tejwani and Om Puri.
Analyzing the type of content on Netflix
We can analyze how much content and the type of content i.e movie or shows that have been released on Netflix. For relevancy, we will filter the data for years greater than or equal to 2010. This will generate a line graph showing whether there is an increase or decrease in the content.
# Filter the data for release years greater than or equal to 2010
df_filtered = df[df['release_year'] >= 2010]

# Group the data by release year and type, then count the occurrences
df_grouped = df_filtered.groupby(['release_year', 'type']).size().reset_index(name='total_content')

# Generate the line graph
fig = px.line(df_grouped,
              x='release_year',
              y='total_content',
              color='type',
              title='Analyzing Content on Netflix',
              labels={
                  'release_year': 'Release Year',
                  'total_content': 'Total Content',
                  'type': 'Type'
              })

# Show the plot
fig.show()
The movie line in the graph, represented by the blue line, demonstrates a notable increase in releases in 2018 with a peak of 767 releases. The global pandemic's start is probably to blame for this number's dip to 633 in 2019. It then proceeded to fall in the next years, with 517 in 2020 and a low of 277 in 2021. This pattern points to a significant influence on film production and release dates, which reflects broader industry difficulties at the time.
On the other hand, the red line for TV shows illustrates that, although they were always less than movies, the trajectory for TV show releases was different. With 436 releases, 2020 was notable for having the most TV show releases ever. From 380 in 2018 and 397 in 2019, this marked an increase. The peak year for TV shows in 2020 could point to a tactical change made by Netflix in response to shifting user preferences and production constraints during the pandemic, exposing disparities in the way various kinds of material were released and controlled.
Sentiment Analysis of Content
To conclude, we will conduct a sentiment analysis of the content based on the descriptions provided. We will use Textblob for this purpose.
# Filter the data for release years greater than or equal to 2010
df_filtered = df[df['release_year'] >= 2010]

# Perform sentiment analysis on the descriptions
def get_sentiment(description):
    analysis = TextBlob(description)
    if analysis.sentiment.polarity > 0:
        return 'Positive'
    elif analysis.sentiment.polarity < 0:
        return 'Negative'
    else:
        return 'Neutral'

# Apply the sentiment analysis to the descriptions
df_filtered['sentiment'] = df_filtered['description'].apply(get_sentiment)

# Group the data by release year and sentiment, then count the occurrences
df_grouped = df_filtered.groupby(['release_year', 'sentiment']).size().reset_index(name='count')

# Generate the bar graph
fig = px.bar(
    df_grouped,
    x='release_year',
    y='count',
    color='sentiment',
    title='Sentiment Analysis of Netflix Descriptions by Release Year',
    labels={
        'release_year': 'Release Year',
        'count': 'Total Content',
        'sentiment': 'Sentiment'
    },
    color_discrete_map={'Positive': 'green', 'Negative': 'red', 'Neutral': 'blue'}
)

# Show the plot
fig.show()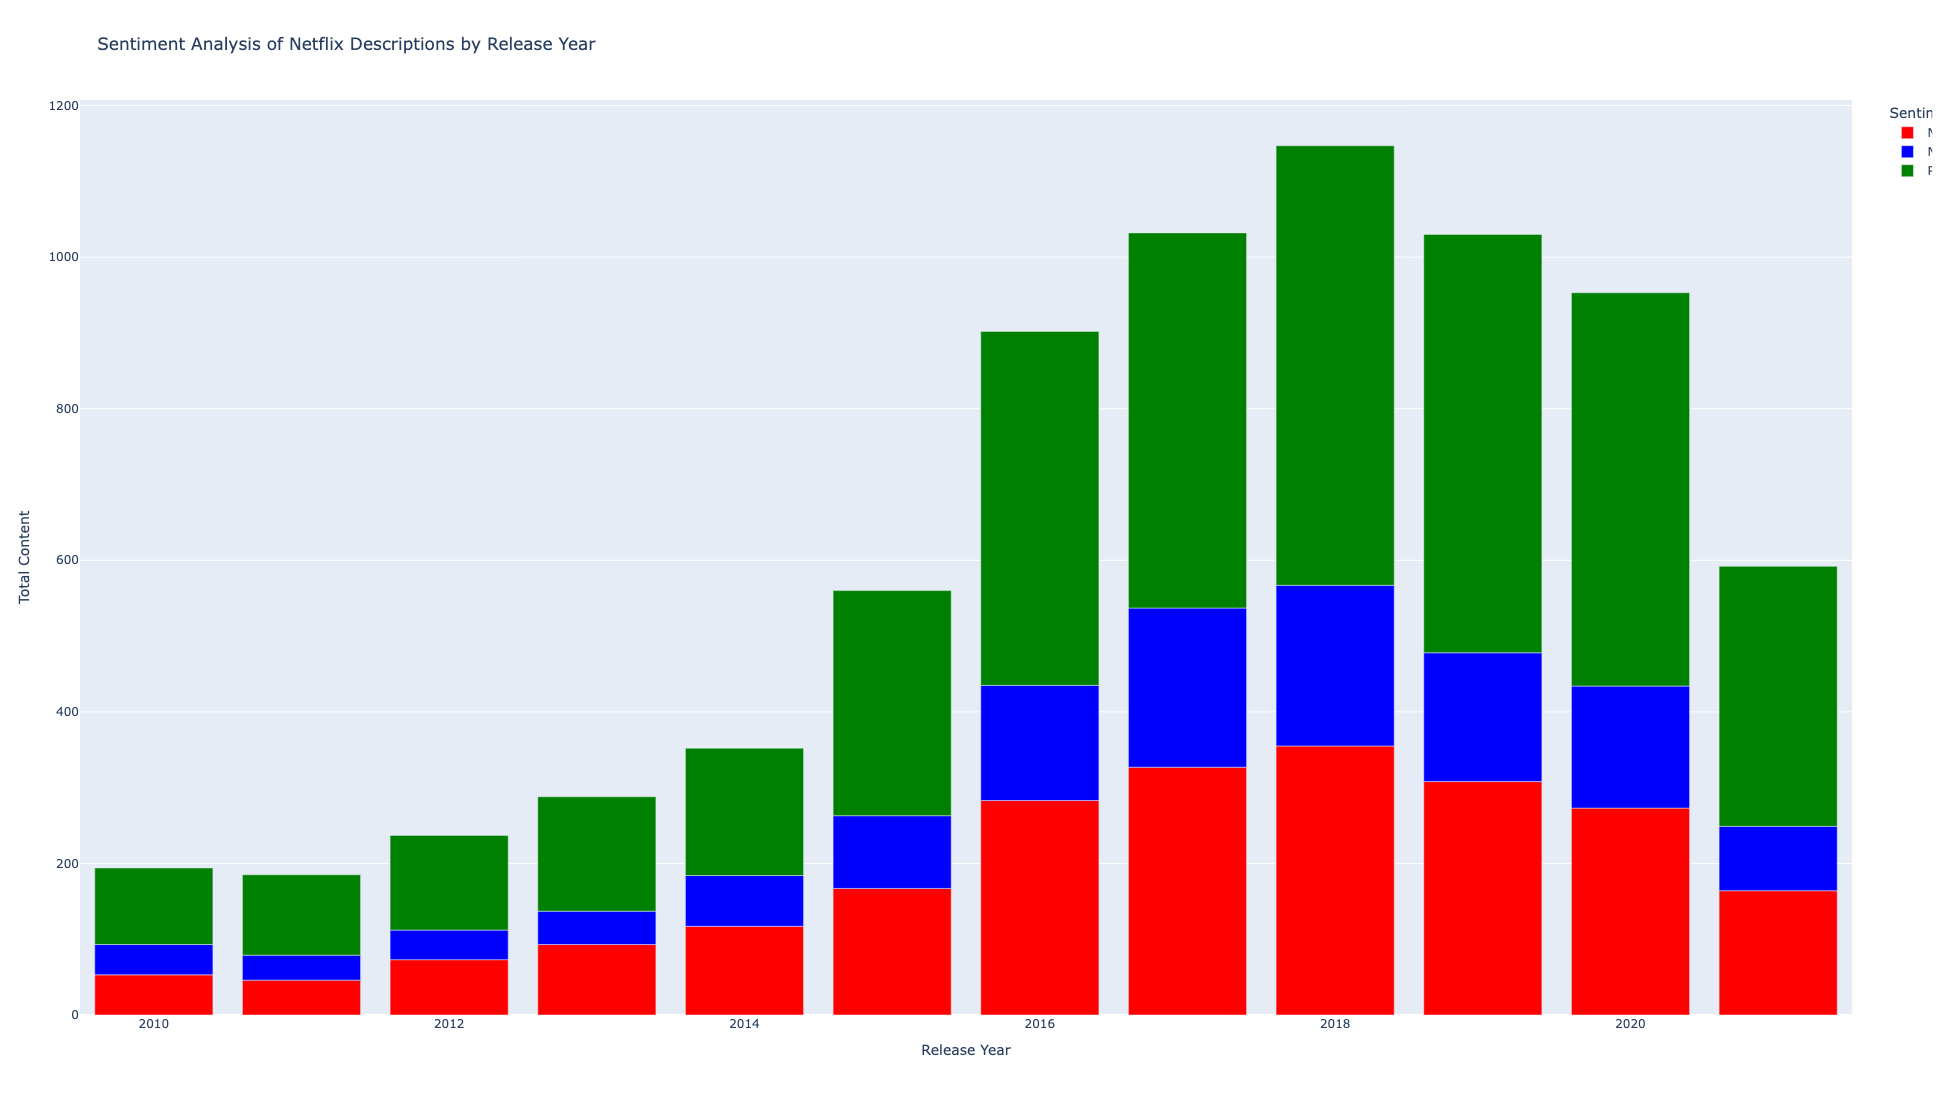
*Green: Positive ; *Red: Negative; *Blue: Neutral
A sentiment study of Netflix titles from 2010 onward reveals a general rise in material with a wide range of sentiments, with positive and negative descriptors peaking in 2018 and 2019, suggesting a wide range of narratives during these productive years. Positive attitudes remained noticeably high despite a fall in titles in 2020 and 2021, which was probably caused by the global pandemic. This suggests an inclination towards uplifting content during difficult times. A shift towards more factual descriptions may be indicated by the steady increase in neutral sentiments since 2016, which is consistent with Netflix's efforts to accommodate a wide range of audience preferences and emotions.
Conclusion
As we reach to the end of our investigation into Netflix's content ecosystem, it is clear how the platform's dynamic tactics and content selection have changed over time. Our adventure reveals the complex network of choices and factors that shaped one of the major figures in the entertainment business, from content distribution to finding outstanding directors and actors to improving the overall sentiment of the content.
Please feel free to ask your valuable questions in the comments section below.